Recent data published by Resiclub gives a fascinating view into seasonality — but also how seasonality plays into the sale or purchase of a home.
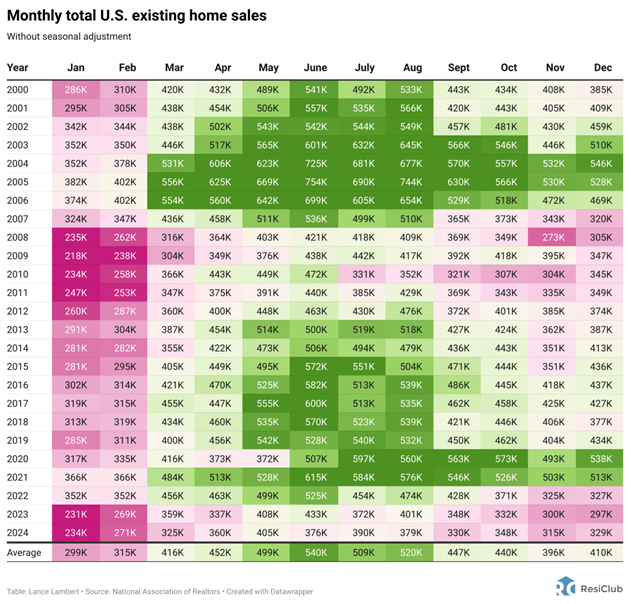
This chart shows seasonality (but it’s important to understand this doesn’t really reflect “snowbird states” like Florida – it’s a national look).
We see sales start off slow in January, and then start to accelerate through to a peak in August and then start a slide down again. Why? Parents tend to want to purchase homes in spring, allowing them to move in before school starts; the effect of tax refunds in spring; weather issues in colder climates (who wants to view an open house in freezing January?); and the self-reinforcing strategy by some homeowners, aware of this seasonal trend, who choose to list their properties in the spring to attract the largest pool of buyers – which also has the effect of boosting inventory and choices for buyers.
And so we see the effect that this can have on prices:
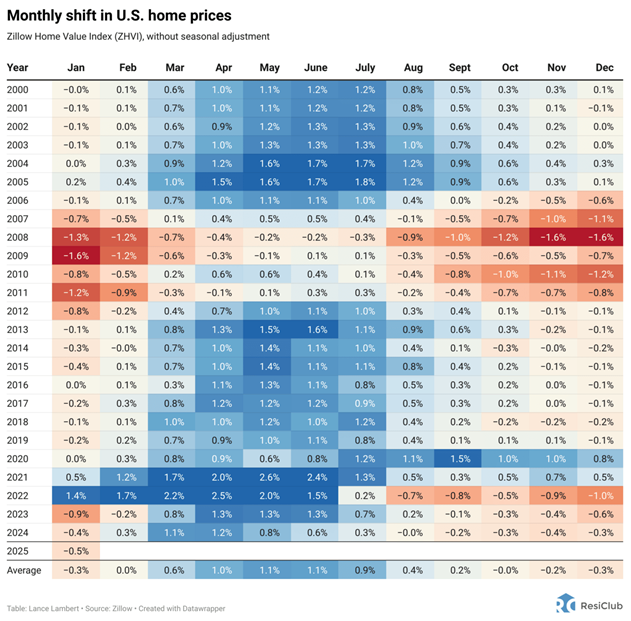
This is an extraordinary chart, because it shows that simply waiting a few months to sell a home can result in a “bump” of 1% – and holding off until the wrong time can actually negatively impact the price. While not earth-shattering — median home sales are around $420k – so 1% means $4,200 increase — it’s still real money. And as a buyer, you have an incentive to hold until later in the year, although that may mean you won’t get your dream home. But importantly for sellers, there’s the psychological effect of sitting on a home that’s not selling fast, simply because you listed it during the wrong time of year…
(Thanks to Resiclub for this data and the insights they provided.)